How to Turn Production Analytics into Weighted User Journeys
Translate analytics into realistic load-test journeys while correcting for bots, retries, cache hits, seasonality, and missing client events.
Analytics rarely arrives as a ready-made load profile. It counts page views, events, sessions, or server requests, each with its own sampling and blind spots. To turn it into weighted journeys, keep the evidence chain intact: what was measured, what you inferred, and what the test simplifies on purpose.
Pick a reliable unit
Choose a denominator that fits the decision. For a public API, arrivals per minute may work best. For a purchase flow, completed orders or checkout starts may mean more. For a logged-in product, active sessions can define the population while transactions define the work.
Do not mix browser events and server requests without a mapping. One “search” event can trigger several API calls, and one server request can be a retry or a background refresh. Write the boundary and the time window next to every source.
Clean the evidence
Filter out health checks, synthetic monitors, known crawlers, internal tools, and duplicate events where you can identify them. Keep a count of what you removed. Do not assume an unknown user agent is a bot, or that every missing browser event is an abandoned journey.
Separate retries from first attempts where you can. If a timeout causes three server requests, counting all three as new journeys overstates demand. Ignoring retries hides work the system has to absorb. Model retry behavior explicitly in a failure scenario.
Build a journey table
Make rows for browse, search, sign in, detail view, write, export, and any other meaningful flow. Add the observed share, arrivals in the chosen peak window, requests per journey, data needs, cache state, and business consequence. The weights should sum to 100 percent for the scenario. Reality is not known that precisely, but the test has to be reproducible.
Say a hypothetical peak has 600 journeys per minute: 50 percent browse, 30 percent search, 15 percent account work, and 5 percent checkout. The weighted arrivals are 300, 180, 90, and 30 per minute. If checkout is the release risk, its five percent share still needs detailed state, unique data, and its own acceptance criterion.
Correct for cache and client bias
Analytics can overrepresent cache hits because a client event fires before a server call completes. Server logs can overrepresent retries and polling. Build warm, cold, and mixed cache scenarios when cache behavior changes the result. Name whether a journey uses a CDN, an application cache, or a database read.
Browser analytics also misses blocked scripts, offline sessions, and navigation that never completes. A gap in instrumentation does not prove there was no demand. Cross-check with server-side counts, traces, or business records, and describe the uncertainty in words when you cannot give a precise interval.
Account for time shape
Daily averages erase the launch minute. Keep the hourly or minute-by-minute curve for a peak-event scenario. Model ramp, cliff, plateau, and decay separately. A normal-day profile can serve as a baseline while a release-day profile answers the readiness question.
When historical data is thin, use scenarios instead of a hidden multiplier: observed peak, planned peak, and stress peak. Label the stress case as a what-if. The capacity planning and traffic modeling guide pairs well with this practice.
Translate sessions into work
Define what a session does. A virtual user that signs in once and loops through catalog reads is not the same as a user who searches, opens details, adds an item, and waits before checkout. Include think time and pacing so you can still explain concurrency and arrival rate.
Use Little’s Law as a check, not as a conversion shortcut. If a journey has an estimated 8-second end-to-end time and 25 arrivals per second, rough in-flight work is 200. If the test needs 2,000 VUs to reach the same rate, investigate the boundary, pacing, or generator instead of hiding the mismatch.
Validate the model with a dry run
Run one user per journey and compare the request labels with production evidence. Then run a small mixed profile and check that observed proportions, cache state, errors, and data mutations behave as intended. Make sure polling and retries do not quietly take over the workload.
Store a model version with the result. When analytics changes, update the weights on purpose and compare like with like. The weights are defensible only while you keep the assumptions, source window, and transformation steps that produced them.
The result should answer two questions: what did we simulate, and why? A weighted journey table, a time curve, a correction log, and an uncertainty note tell a reader far more than a single claim that the test was realistic.
Worked translation example
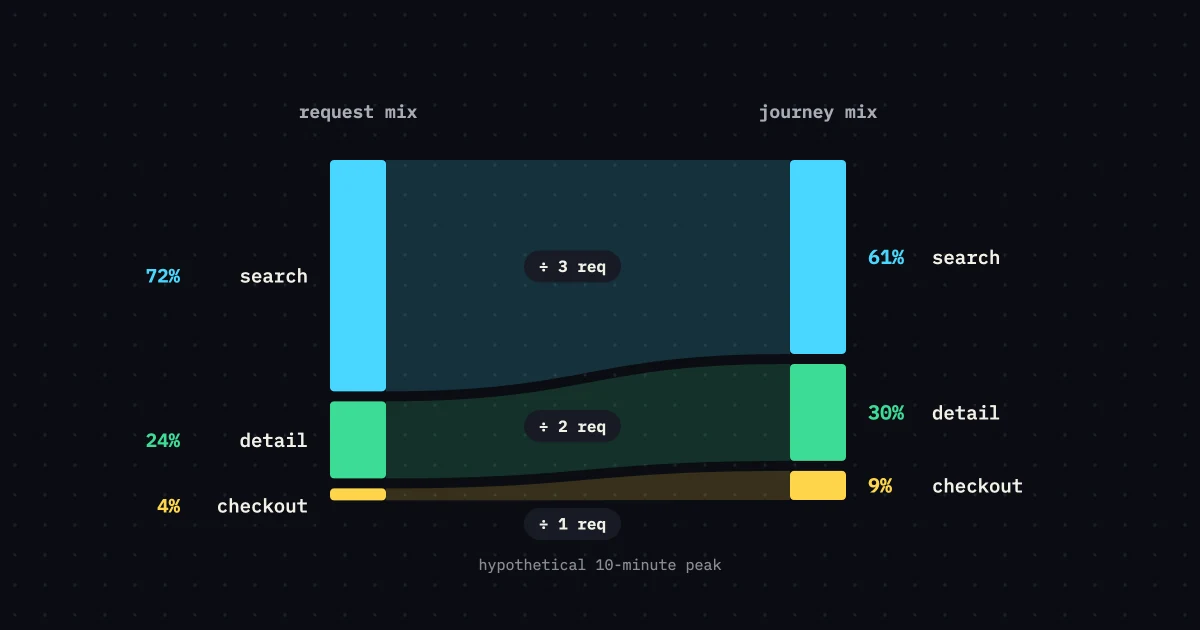
Say server evidence for a 10-minute peak holds 18,000 search requests, 6,000 detail reads, and 900 checkout starts. That is a request mix. It is not yet a journey mix. If a search journey averages three requests and a detail journey averages two, the approximate journey counts are 6,000 search journeys and 3,000 detail journeys before retries. Checkout may already be one transaction per start. Keep those divisors as assumptions and check them against traces.
Now add a browser event stream that reports 8,000 searches. The gap may come from blocked analytics, client retries, or server-side calls with no browser event. Do not pick the smaller number because it is convenient. Compare user agents, trace samples, and cache state, and build a scenario range if you cannot close the gap.
The resulting artifact should hold the raw counts, the transformation arithmetic, the final weights, and the unresolved gaps. When a later run changes the weights, a reviewer can see whether a performance change came from code or from a better workload model.
Keep a deliberately conservative scenario for unknowns. If you cannot separate retries, show a first-attempt baseline and a retry-inclusive stress case instead of silently picking one number. That range gives capacity owners a decision boundary while analytics work continues.
Review the weights with product and operations owners. Product knows which journey carries value. Operations knows the background calls, retries, or quotas that create pressure. When they disagree, keep both scenarios and state why. A range is often more honest than a compromise nobody can defend.
At the end of each scenario, compare modeled and observed proportions. If searches generate more retries than expected, do not quietly change their weight after the run. Keep journey weight apart from request amplification, because the difference may be the performance finding. Store the raw analytics window, transformation rules, and final artifact version together.
Test the weighting model with a sensitivity pass. Raise one uncertain journey, such as authentication or search, while holding total arrivals constant, and note which dependency becomes the limit. If a five-point change in one share flips the capacity decision, the model is too uncertain for a single go/no-go number. Run both bounds and document the operational choice. Also keep users and requests apart: one weighted journey can make several calls, and retries can multiply them again. Report the journey mix, the request mix, and the retry-inclusive mix separately so nobody reading a chart mistakes a business proportion for wire traffic. This matters most when the analytics window contains bots, internal traffic, or a campaign unlike the release you are testing.
Before you convert percentages into a generator schedule, choose the denominator and the rounding rule. A small but expensive admin journey can vanish if you round percentages to whole numbers, and a high-volume read can be overrepresented if bot traffic stays in. Keep fractional weights in the model and let the scheduler normalize them. Then inspect the generated request counts for a trial window. If the realized mix differs a lot, check iteration duration, failed steps, and generator throttling before you change business weights. The schedule implements the model. It is not the model.