Virtual Users vs Requests per Second: Which Load Model Should You Use?
Understand the difference between virtual users and requests per second, then choose the control variable that matches real demand.
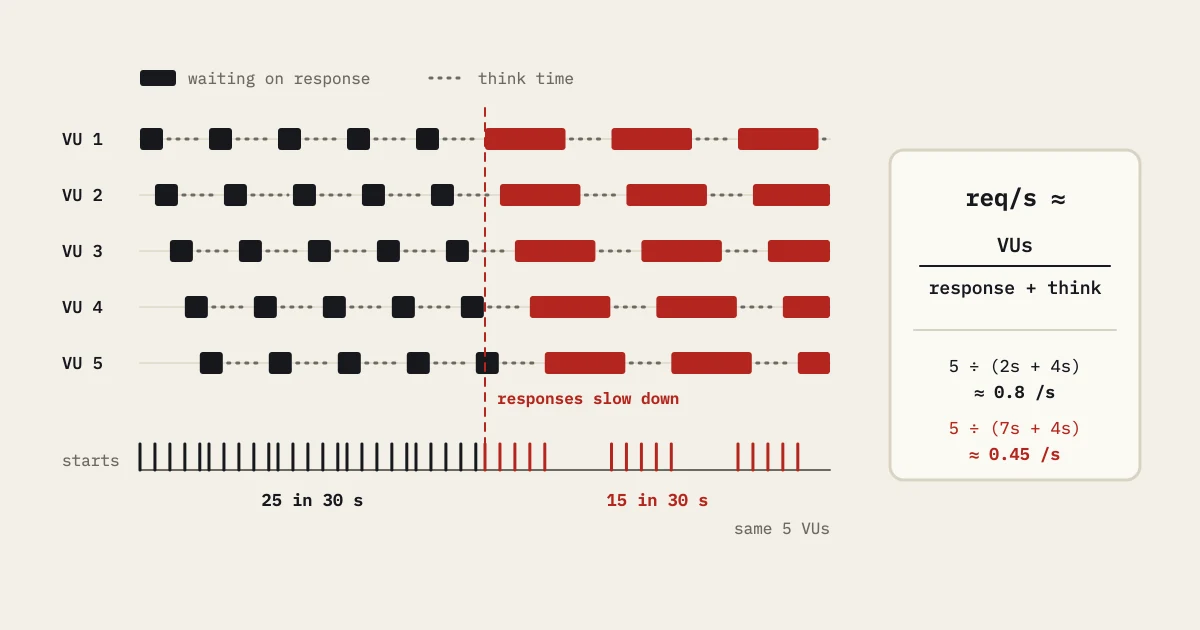
Virtual users and requests per second describe different parts of a load test. A virtual user is an actor moving through a flow. Requests per second counts arrivals at a boundary. Mix them up and your test quietly changes its workload when the system slows.
What a virtual user means
A virtual user usually owns a session. It signs in, reads data, pauses, performs an action, and repeats. If a journey takes 20 seconds and 100 users each have one active journey, the test has 100 concurrent actors. How many requests those actors send depends on the flow, response times, and pacing.
VUs fit when users are the scarce thing you want to model. A subscription dashboard, for example, may have a known population of active sessions. The test keeps a mix of journeys and think times while you watch how the system behaves as the population grows.
VUs work poorly as a stand-in for a fixed traffic commitment. When a response slows, a closed VU loop spends more time waiting and sends fewer new iterations. That may model a group of people waiting for pages correctly. It may also hide the queue that an independent upstream producer would keep filling.
What requests per second means
RPS measures arrivals: how many requests cross a boundary per unit of time. Some teams use transactions per second for complete business operations and keep RPS for individual requests. Define the term in your plan. “Throughput” without a boundary is too vague.
An arrival-rate model schedules work at the requested rate whether or not earlier work has finished, within capacity and any explicit backpressure. That suits queues, webhook consumers, scheduled jobs, and public traffic, where demand does not politely slow down because one response is late.
Arrival control forces a decision about overload. Should new work queue, fail fast, shed load, or get a retryable response? A generator should not create an unbounded retry storm just to hold a target rate. Track scheduled and achieved arrivals separately.
A simple choice rule
Ask what stays true in production when latency rises:
- If the number of active actors is the invariant, begin with VUs and make their sessions realistic.
- If an upstream source keeps producing work at a rate, begin with arrivals or transactions per second.
- If both matter, use a layered test: an arrival-rate workload for the public boundary and a smaller browser or session cohort for user experience.
The choice follows causality, not tool preference. A VU test can still report RPS, and a rate-based test can still carry session state. What matters is which variable you hold steady while you change the load.
Make the conversion explicit
Little’s Law gives you a sanity check: average concurrency equals throughput multiplied by average time in the system. If a journey creates 2 iterations per second and takes 5 seconds on average, you can expect roughly 10 active iterations. That is an estimate. It does not replace measuring a distribution, and long tails can make the average misleading.
Take a hypothetical journey with 50 VUs, a 10-second service time, and no think time. Its closed-loop rate is roughly 5 iterations per second. Add 10 seconds of think time and the rough rate falls toward 2.5 iterations per second. If your production boundary must receive 5 arrivals per second no matter what, VUs alone will not hold that demand as latency grows.
Write down whether requests per iteration include redirects, polling, asset calls, and retries. A browser page can create many network requests, while a protocol test may model only the API calls that carry business meaning. Compare the two totals without a boundary definition and you invite false conclusions.
Watch for coordinated omission
A closed loop can stop sending new samples while an earlier sample is delayed. The reported distribution then covers only the requests the generator managed to start, not all the work that would have arrived at the intended rate. This is one form of coordinated omission. An open model helps reveal it, but only if the generator records delayed, dropped, and queued work instead of hiding it.
Use both views when they answer different questions. A closed model shows how an interactive population experiences the system. An arrival model shows whether queues grow under fixed demand. Keep their results in separate scenarios so one chart does not blend incompatible workloads.
Document the model in the result
Each run should name the control variable, journey mix, pacing, scheduled rate, achieved rate, active sessions, and response-time definition. Include the generator’s own CPU, network, and queue signals. If the generator cannot reach the target, the run is a generator-capacity finding, not a target-capacity finding.
The practical answer is often “one or both.” Start with the model that matches the production invariant, then add the other where it exposes a real risk. Put that invariant in the result title and the run brief, so a future reader can tell what stayed fixed.
A concrete planning worksheet
For each scenario, write four rows: control variable, journey state, overload behavior, and evidence. An import worker may use 12 job arrivals per second, hold a job ID until completion, queue when workers are busy, and report enqueue-to-finish time. A customer browse flow may use 400 active sessions, keep think time, and report page completion. The same API can appear in both rows, and the scenarios are still not equivalent.
Run a small calibration to find how VUs map to achieved rate under your chosen pacing. If 40 actors produce 8 iterations per second at 1 second of work and 4 seconds of think time, the result is about 8, not a guarantee that 40 actors always means 8. Record the observed rate and response distribution. When the service slows, redo the calculation instead of silently changing how you read it.
This worksheet also prevents a common reporting error: calling a VU count “traffic.” Report active actors, iterations, requests, and arrivals as separate quantities. A reader should be able to rebuild the workload from the result and see which number was held steady.
Handle backpressure explicitly
Say a queue consumer is scheduled for 50 arrivals per second. When the queue is full, the producer might get a 429, a durable acceptance, or a connection timeout. Each choice makes a different test. Record accepted, rejected, retried, and completed work. If the generator retries at once, it measures a client storm as much as it measures the queue.
For interactive users, the same endpoint may run under a closed session model. Users can wait, abandon, or refresh. Model abandonment if it matters, and report the active population separately from the request stream. The VU-to-RPS ratio comes from flow and pacing. It is not a fixed property of the tool.
Put these distinctions in the result title and review summary. A reader should never have to guess whether “10,000 users” means active sessions, scheduled arrivals, or completed journeys. Naming the invariant is the simplest guard against an impressive but ambiguous load number.
When the workload has two independent sources, keep two controls. Fixed webhook arrivals can feed a queue while active users check status. Report queue acceptance and viewer concurrency separately, then combine only the downstream signals that truly overlap. That is more precise than forcing both sources into one virtual-user script.
Make that invariant the first line a reviewer sees.