Is Your Load Generator the Bottleneck? How to Find Out
Cross-check generator CPU, event-loop delay, sockets, bandwidth, achieved arrivals, and worker agreement before blaming the target.
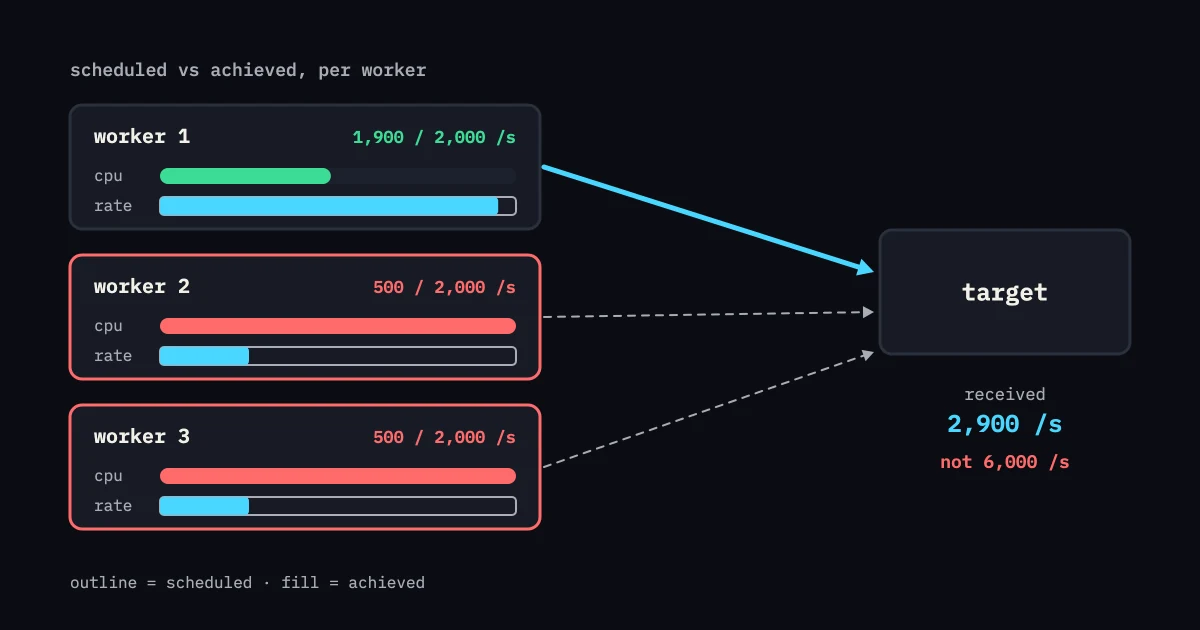
When latency rises during a load test, you suspect the target first. The generator may be the system that is limiting. A saturated client can miss arrivals, delay sockets, and report a distorted tail. Prove which side is constrained before you change application capacity.
Establish a low-load control
Run one journey at a low rate and record client CPU, memory, event-loop delay, sockets, bandwidth, DNS, and achieved arrivals. Keep the target’s latency and errors as a control. Raise load in steps and keep the same telemetry.
If the target stays quiet while the generator’s CPU or event loop saturates, run a generator experiment next. If both rise together, the evidence is mixed and you need to isolate further.
Check achieved, not requested, load
An arrival scheduler can ask for 10,000 arrivals per second while the worker starts fewer. Record scheduled, started, completed, dropped, late, and retried work. A healthy response chart built only from the work that started does not prove the target handled 10,000 arrivals.
In a hypothetical test, you might ask three workers for 2,000 arrivals per second each. If one reaches 1,900 and two reach 500 because of CPU or network limits, you cannot report the aggregate as 6,000. Worker-level evidence shows the missing workload.
Inspect client resources
CPU saturation can delay scheduling and response processing. Memory pressure can trigger garbage collection and add a client-side tail. File descriptors, ephemeral ports, connection pools, TLS handshakes, DNS, and bandwidth can each cap a worker. Measure them during the ramp, not only after a failure.
Connection reuse matters. A scenario that opens a new TLS connection for every request stresses the generator and the target differently from a keep-alive workload. State the behavior you intend and check it with connection metrics.
Compare independent workers
Use several workers with the same artifact and partitions. If their achieved rates and latency shapes agree while target telemetry rises, target saturation becomes more likely. If one worker diverges, look at its placement, limits, or data. Agreement does not prove the target is the bottleneck. Disagreement is a clear reason to stop and look.
Distributed execution adds clock and network differences. Carry worker identity into the results and align time windows. Read the distributed load testing material before you combine worker summaries.
Use a step experiment
Hold the target workload steady and add generator capacity. If achieved arrivals go up while target latency stays about the same, the generator was the limit. You can also hold the generator count steady and reduce client work, such as connection churn, but only in a safe diagnostic scenario. If the target responds to that change, the workload itself changed and the result is not a direct comparison.
Do not tune the generator by removing checks, retries, or important response processing without recording it. A lighter client may reach a rate more easily and stop proving correctness at the same time.
Watch for false confidence
A generator can look underloaded because the target returns fast errors. A test that skips assertions can look efficient while it sends invalid requests. A cache hit can cut server work and hide a client ceiling. Keep business checks and status segmentation visible.
Save generator health with the run evidence. Target metrics tell you what the service experienced. Generator metrics tell you what the test could deliver. Achieved workload connects the two.
A generator readiness checklist
- Establish a one-worker low-load control.
- Record CPU, memory, event-loop delay, sockets, ports, DNS, bandwidth, and connection reuse.
- Compare scheduled with started, completed, dropped, and late work.
- Check agreement across workers and locations.
- Repeat after a controlled capacity change.
Investigate the target’s queue, pools, database, or autoscaler only after those checks. Otherwise a generator ceiling can push the team into an expensive application fix for a problem in the measuring tool.
A controlled capacity experiment
Run the same artifact with one worker, then with two, and keep the arrival schedule and target placement the same. If achieved work doubles and the target’s labeled latency changes as expected, the first worker was probably the limit. If achieved work does not change, inspect the target or a shared network boundary. Keep connection reuse and assertions unchanged. Removing checks to gain rate invalidates the comparison.
Keep the conclusion narrow. It shows that a worker ceiling exists under this workload. It does not show that every future scenario needs the same worker count. Store the evidence with resource limits and image version so you can reproduce it after the generator changes.
Record the generator ceiling as a test constraint. It is not a target limit, and a different worker size or location may move it. Recheck the one-worker control and compare achieved rate before you read meaning into a changed latency curve. That way a tool upgrade is not mistaken for an application regression.
Report the generator’s limiting signal next to the target result. A worker at its CPU limit, a full socket table, and a bandwidth ceiling each call for a different fix. If you see none of them, label the conclusion uncertain and run a smaller experiment with more instrumentation.
Triangulate a suspected ceiling
Start with a one-user journey and keep its business assertion. Then run the same artifact at a small rate on one worker. Record scheduled starts, achieved starts, completions, retries, CPU, memory, event-loop delay, open sockets, file descriptors, and bandwidth. A low achieved rate with an idle target suggests the generator. A low target rate with healthy workers points somewhere else. Treat neither as proof until the control repeats.
Add a second worker and leave the target, fixture, client settings, and schedule alone. If the achieved rate rises roughly with worker count and per-worker saturation stays similar, the fleet was probably the limit. If it stays flat, inspect a coordinator, network path, target, or dependency boundary. Check that the second worker did not change connection reuse, DNS, TLS, pacing, or data allocation. Any of those can make the comparison false.
Use independent signals to tell common ceilings apart. CPU saturation with event-loop delay points to computation or serialization. A full socket or file-descriptor budget points to connection management. High bandwidth with modest CPU points to payload or compression cost. A worker that reaches its configured limit while the target sees the intended rate may be applying backpressure correctly. Capture limits and the achieved-to-scheduled ratio so a reviewer can tell policy from failure.
Keep correctness in the experiment. Removing checks, retries, authentication, or cleanup can raise generator capacity and change the workload at the same time. If you need a lighter protocol client, pair it with a browser or end-to-end control and state which user-facing behavior it leaves out. If the generator misses the requested schedule, report only the achieved workload. Do not turn it into a capacity claim for the target.
After a worker change, rerun the smallest reproduction and then the full profile. Put edge rate, server rate, errors, queue age, and worker saturation on one timeline. The handoff should name the highest valid achieved load, the limiting signal, the worker image and limits, the location, the network path, and the next experiment that would tell the causes apart. The test system then becomes a visible part of the result instead of a hidden source of doubt.
For a quick comparison, hold the target at a known low rate and change only the worker count. If client CPU falls and achieved arrivals rise, the old fleet was the limit. If target latency changes while workers still have headroom, look at the target or the network instead. Keep both control runs so someone can still test the conclusion later.