Comparing Load-Test Runs Without Mistaking Noise for Regression
Learn how to compare load-test runs by locking workload and environment, inspecting distributions, and setting an effect threshold before reacting.
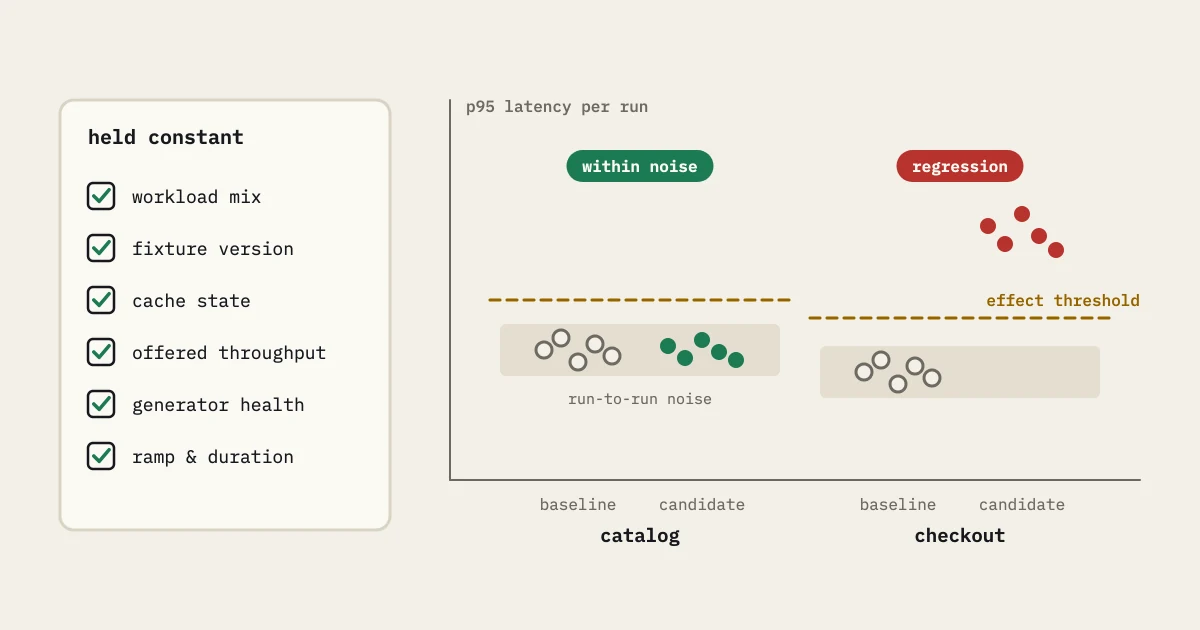
Two load-test runs can produce different numbers even when the code is unchanged. A noisy network, a cold cache, background work, a shifted fixture mix, or a busy load generator can move a percentile. Comparison still works, but it needs a contract.
The contract is short. Compare the same workload against an environment you can describe, use distributions instead of one summary number, and decide in advance what size of change matters. Without those conditions, a dashboard can turn ordinary variation into a false regression, or hide a real one in a broad average.
Freeze the question first
Start by writing down the decision the comparison should support. You might be checking that a release preserves a checkout p95 or investigating a resource change. You might be choosing a capacity point. Each question needs a different run length, labels and evidence. Don’t pick a metric after seeing the result, because that invites confirmation bias.
Name the baseline and candidate. Record commit, configuration, schema, feature flags, test data version, load profile, traffic mix, test duration, ramp, and generator location. If any of these differ, say whether the comparison is exploratory or release-grade. An honest “not comparable” beats a precise-looking conclusion built from different inputs.
The anatomy of a load-test result is a useful checklist for the metadata that should travel with a run. Without that context, a latency number has no reliable explanation.
Make the workload identical enough
Identical here means the distribution of work stays constant enough that you can attribute a changed result. Every virtual user does not have to follow the same script forever. Keep request labels stable. Keep the ratio of reads to writes stable. Keep pagination, payload sizes, authentication paths, and think time under control.
Dynamic data needs special attention. A baseline that reads a warm set of records is not equivalent to a candidate that creates new records and misses the cache. If the purpose is to test that behavior, make it intentional and record it. If not, use the same fixture preparation and cache procedure for both runs.
The generator is part of the workload too. Check its CPU, memory, network, connection count, and error logs. A saturated generator can make the service look faster by failing to apply the intended pressure, or slower by adding client-side delay. If the load driver was unhealthy, the run cannot give a performance verdict.
Read the whole distribution
Use average latency to orient yourself, not to decide. Inspect p50, p90, p95, and p99 where the tail matters, and look at the shape over time. A stable median with a widening tail suggests a different problem from a shift across the entire distribution. Plot or inspect histograms when possible; percentiles alone can conceal multimodal behavior.
Segment the result by operation, status class, assertion, and time window. An overall p95 can improve while a small but important operation degrades. Error responses can also be faster than successful responses, pulling the average down at exactly the moment the user experience is failing. The results analysis use case covers this principle in a product-oriented workflow.
Watch throughput and concurrency alongside latency. If offered load fell in the candidate, a lower p95 may only mean the service received less work. If concurrency climbed while throughput stayed flat, the system may be at a saturation point. Every comparison should say whether both runs delivered the intended pressure.
Repeat where the decision warrants it
One run is often enough to find an obvious failure and rarely enough to characterize a subtle change. Repeat a controlled baseline and candidate when the observed difference is near your decision boundary. Use the same run protocol, and avoid cherry-picking the most favorable result. A small set of independent repetitions gives you a sense of run-to-run spread.
Match the amount of repetition to the risk. A short pull-request check can use a conservative signal and defer confirmation to a scheduled baseline. A release candidate for a critical path deserves stronger evidence. Document which level a check belongs to so nobody treats a smoke result as a capacity study.
Set an effect threshold
Statistical significance and operational importance are different things. With enough samples, a tiny change can look convincing and still have no effect users would notice. A real tail regression, on the other hand, can be hard to tell from noise in a small run. Define an effect threshold that reflects the service objective, not a universal percentage.
For example, a team might require that a named operation stay below a latency budget and that its error rate not cross a fixed tolerance. Another team may compare a confidence interval or an outlier-resistant spread measure. The exact method is less important than publishing it before the run and applying it to the same label in both directions.
If you cannot justify a threshold yet, label the result as a signal for investigation. Do not convert uncertainty into a pass. The CI gate guide shows how explicit criteria make this distinction visible to reviewers.
Explain the result in the change record
A useful comparison answer fits in a change record: what changed, what stayed fixed, which labels moved, whether throughput matched, what evidence supports the effect, and what action follows. Link the two runs and include the run timestamp. If the result is inconclusive, state the next controlled experiment.
Performance history then builds up over time. The team learns which metrics are stable, which dependencies add variance and which changes need a larger test. You won’t eliminate every fluctuation. The goal is a line between ordinary noise and a real regression that is clear enough for people to act on.
A compact comparison worksheet
Capture the comparison as a small decision record rather than a screenshot. Include candidate and baseline identifiers, commit or build references, scenario revision, offered workload, fixture state, cache state, generator health, and the metric or assertion that motivated the review. Then write one sentence for the decision: continue, investigate, rerun, or block. If the answer depends on a missing observation, name it and don’t fill the gap with intuition. A useful record also lists what was not compared. For example, a checkout tail can be actionable while a catalog result remains inconclusive because its sample count is too small. Keeping them apart stops teams from averaging away important signal. When the next run arrives, update the same record with new evidence and see whether the original hypothesis survived instead of starting a new argument from an unlabeled chart.
Keep a small worksheet with the baseline and candidate run links, commit identifiers, environment version, generator health, offered load, throughput, operation-level percentiles, error classes, and the decision threshold. Add a note for cache preparation and fixture freshness. If the runs differ on a field, mark the difference instead of filling it with an assumption. A performance review then becomes a repeatable investigation instead of a discussion about screenshots, and the next engineer has enough context to reproduce an uncertain result.
For a concrete review, suppose the candidate’s median is unchanged but its checkout tail is wider while the catalog label is stable. First check offered throughput and checkout error classes, then inspect the database and downstream payment timings for that label. If the generator and workload match, the result supports a focused checkout investigation. It does not support a claim that every API regressed. Reading label by label keeps the scope of an action in proportion to the evidence.