Browser vs Protocol Load Testing: When You Need One—or Both
Learn when protocol tests create scale, browser tests measure user experience, and a small browser cohort should accompany API load.
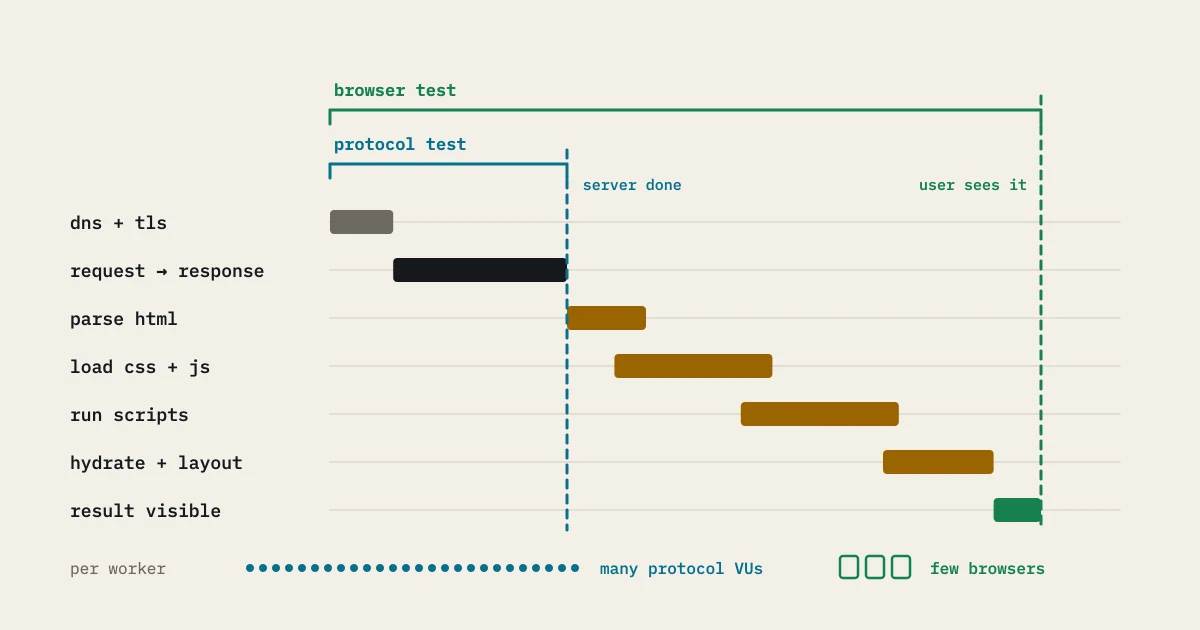
Browser and protocol load tests answer different questions. Protocol tests generate large, controlled volumes of application traffic with relatively little client overhead. Browser tests execute rendering, JavaScript, layout, and network behavior closer to what a person experiences. If you use either one as a substitute for the other, you get a blind spot.
What protocol tests see well
A protocol test can drive API journeys at a scale that would be expensive in full browsers. It controls arrival rate, data allocation, retries and payloads precisely, and it exposes service latency, throughput, errors, queues and dependency saturation. It is the usual first choice for capacity experiments.
Its limit is where it stops measuring. A fast API response does not prove that a page renders quickly. Client-side JavaScript, third-party requests, hydration, image decode, and long tasks can change the experience after the server responds. A protocol test should not claim to measure those stages.
What browsers add
A real browser exercises navigation, document parsing, styles, scripts, layout, and user-visible milestones. It can reveal a large bundle, a render-blocking resource, a client error, or a waterfall that an API histogram cannot. It also costs more CPU, memory, and bandwidth, so a browser worker can become the bottleneck before the target does.
Use a browser cohort for journeys where client experience is the risk: sign-in, search results, checkout confirmation, or a route with heavy hydration. Measure navigation timing and user-visible milestones separately from protocol request timings. Report console errors and failed assertions as results in their own right.
The combined pattern
Run a large protocol workload against the business APIs and a small, representative browser cohort beside it. Align their ramp and mark the browser cohort in the result. This tests backend capacity under demand while checking whether a real client still completes the critical journey.
Don’t imply that the browser cohort represents every user. State its size, device profile, network location, cache state and journey mix. The cohort shows the experience at one chosen operating point. A handful of browsers cannot be multiplied into an exact claim about the whole population.
Keep scenarios from contaminating each other
Use distinct identities and data partitions. Browser clients may load static assets that a protocol test intentionally omits. If both scenarios share a cache, that interaction may be part of the question, or it may skew the result by accident. Decide before the run and record it.
Separate generator telemetry. Track browser CPU, memory, page creation rate, and event-loop delays alongside protocol worker health. If browser navigation slows while API latency stays stable, inspect client resources and the asset waterfall before blaming the service.
A selection checklist
- Need service capacity, queue behavior, or API throughput? Start with protocol.
- Need rendering, hydration, browser errors, or Core Web Vitals? Add browser.
- Need to know whether backend load degrades a critical page? Run a browser cohort beside protocol traffic.
- Need to debug a broken flow? Begin with one browser or one protocol user, not a distributed run.
The browser versus protocol load Academy page explains the boundary in more detail. Choose the smallest browser sample that can answer the user-experience question, then spend scale budget on the protocol model that represents demand.
Interpret the result carefully
Report server and client timings in separate sections. A protocol p95 can improve while browser completion time worsens because of frontend work. A browser failure can be caused by the test fixture, a stale token, or a generator resource limit. Preserve screenshots or traces only when approved and scrub sensitive data.
Match the execution location to the question, and keep each layer’s meaning. Protocol tests apply system pressure. Browser tests show the experience of a chosen cohort. The report keeps those claims separate.
A paired-run example
Take a search release. First run protocol arrivals against search and detail APIs, with cache labels and a response assertion. In the same time window, run a small browser cohort that opens the search page, enters a query, waits for results, and records a user-visible completion. If API p95 remains stable but browser completion grows, inspect JavaScript, assets, and client resources. If both grow, inspect the service path and dependency telemetry.
Repeat with cold cache and a slower synthetic network profile only if those are part of the decision. Keep browser worker CPU and page creation rate visible. The paired result shows where an experience change enters the path. It does not claim that a handful of browsers models the entire population.
Decide what to automate first
Automate the protocol scenario when a release changes a service contract, query path, queue, or dependency. Automate the browser cohort when a release changes route rendering, bundle composition, navigation, or client-side errors. Keep a shared journey name so the results meet in review, but keep timing and pass criteria appropriate to each layer.
Do not turn a browser test into an asset crawler unless asset capacity is the question. Do not turn a protocol test into a fake browser by adding unmeasured calls. A clean boundary makes the result cheaper to run and easier to explain.
Choose the browser cohort from a user-experience question, not from the protocol population divided by a convenient factor. Keep device, viewport, cache, network, and identity profiles stable enough for comparison. If the page uses a third-party asset, record whether it is included or isolated. Otherwise the browser result may measure a provider outside the team’s control.
For each paired run, write one conclusion per layer. “Protocol arrivals reached the target while API p95 stayed within the objective” is one claim. “The browser cohort completed search with no client errors” is another. If the claims disagree, preserve the disagreement and investigate the boundary. A single blended pass/fail status would hide the exact distinction the paired design exists to show.
Also record browser-worker health. A page that opens slowly because the worker is short of memory says nothing about target capacity. Repeat the journey on a second worker or smaller cohort before attributing the tail to the application.
Keep client cost measurable
Give the browser run its own resource budget. Record worker CPU, memory, page count, viewport, device emulation, cache state, and the number of concurrent browser contexts. If page timing worsens while worker CPU is pinned and target request rate is unchanged, try a smaller cohort or a larger worker first. Don’t roll back the application. If target request rate and browser errors worsen together, correlate them before choosing an owner.
Choose milestones that map to user intent. First content, interactive readiness, a completed search, and a durable form submission are different events. Define which requests and client tasks each milestone includes, and capture a failed business assertion even when navigation returns a successful status. Avoid one giant “page loaded” timer that hides a late API call or a JavaScript exception after the visual shell appears.
Keep browser and protocol data comparable at the boundaries that matter. Use the same release and synthetic records, but document cache, cookies, asset delivery, and client geography. A browser may reuse a connection or cache a script while the protocol scenario starts cold. Label that condition. You don’t need to force an identical setup. When a third-party asset is intentionally excluded, state that the browser result does not cover its availability or latency.
Use a paired result to choose a discriminating follow-up. If both layers slow at the same target rate, inspect the shared service and dependency trace. If only the browser slows, compare long tasks, asset waterfalls, worker resources, and client errors. If only protocol slows, confirm the browser actually exercised the request and did not rely on cached state. Repeat the smallest scenario that can distinguish these hypotheses, then keep the conclusion scoped to the evidence.